
|
Vertical Divider
|
News & Trip Reports
Blog style latest information, with thoughts about gear, boats & techniques, upcoming events & trips just completed, including access to trip photo archives.
|
|
Vertical Divider
|
|
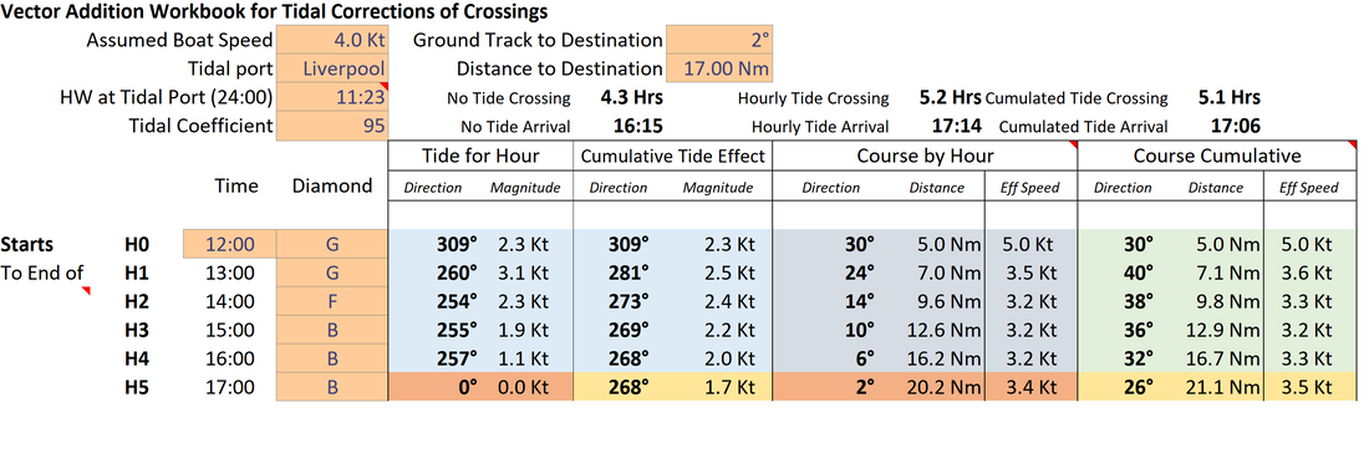
I remember a few years back preparing for my Advanced Sea Leader assessment (back then it was 5 star!), and considering what they might request for a major crossing plan with tidal correction. I wasn't too daunted by the exercise technically, even if they asked for late changes to the plan - (e.g. whoops you're delayed by two hours etc...) - being an engineer & having got my coastal skipper award eons before - but what surprised me was that there didn't appear to be anything readily available to automate the task even for Yachties. So I set about roughing something out using Excel - and in the process encountered some of the complexities, challenges & limitations in making a reliable general purpose tool! I incorporated:
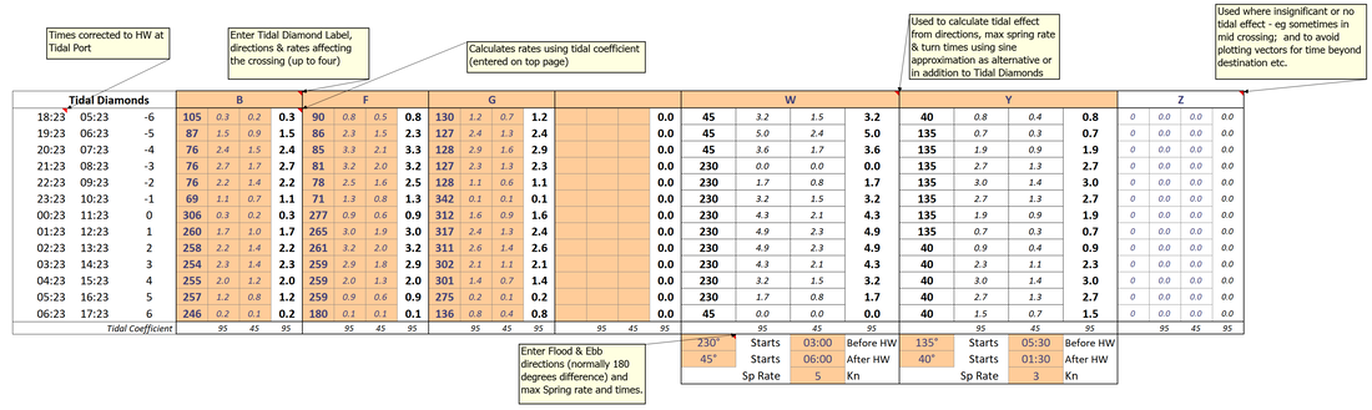
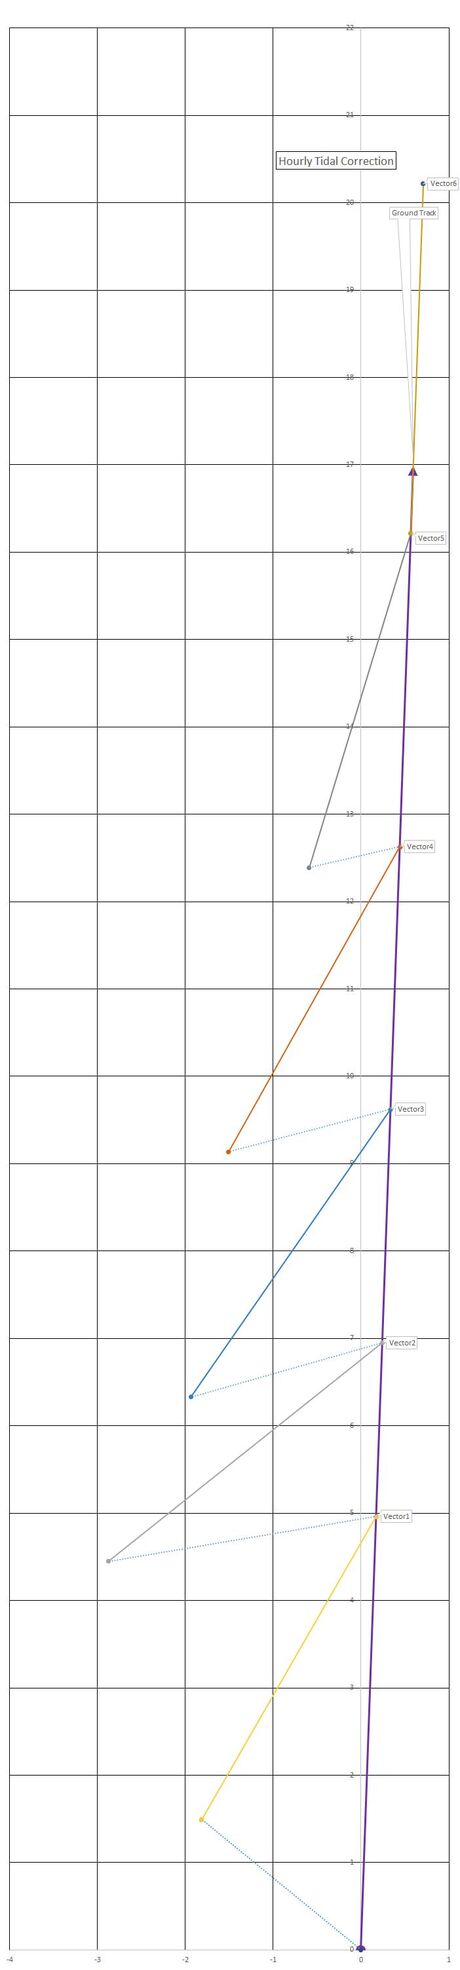
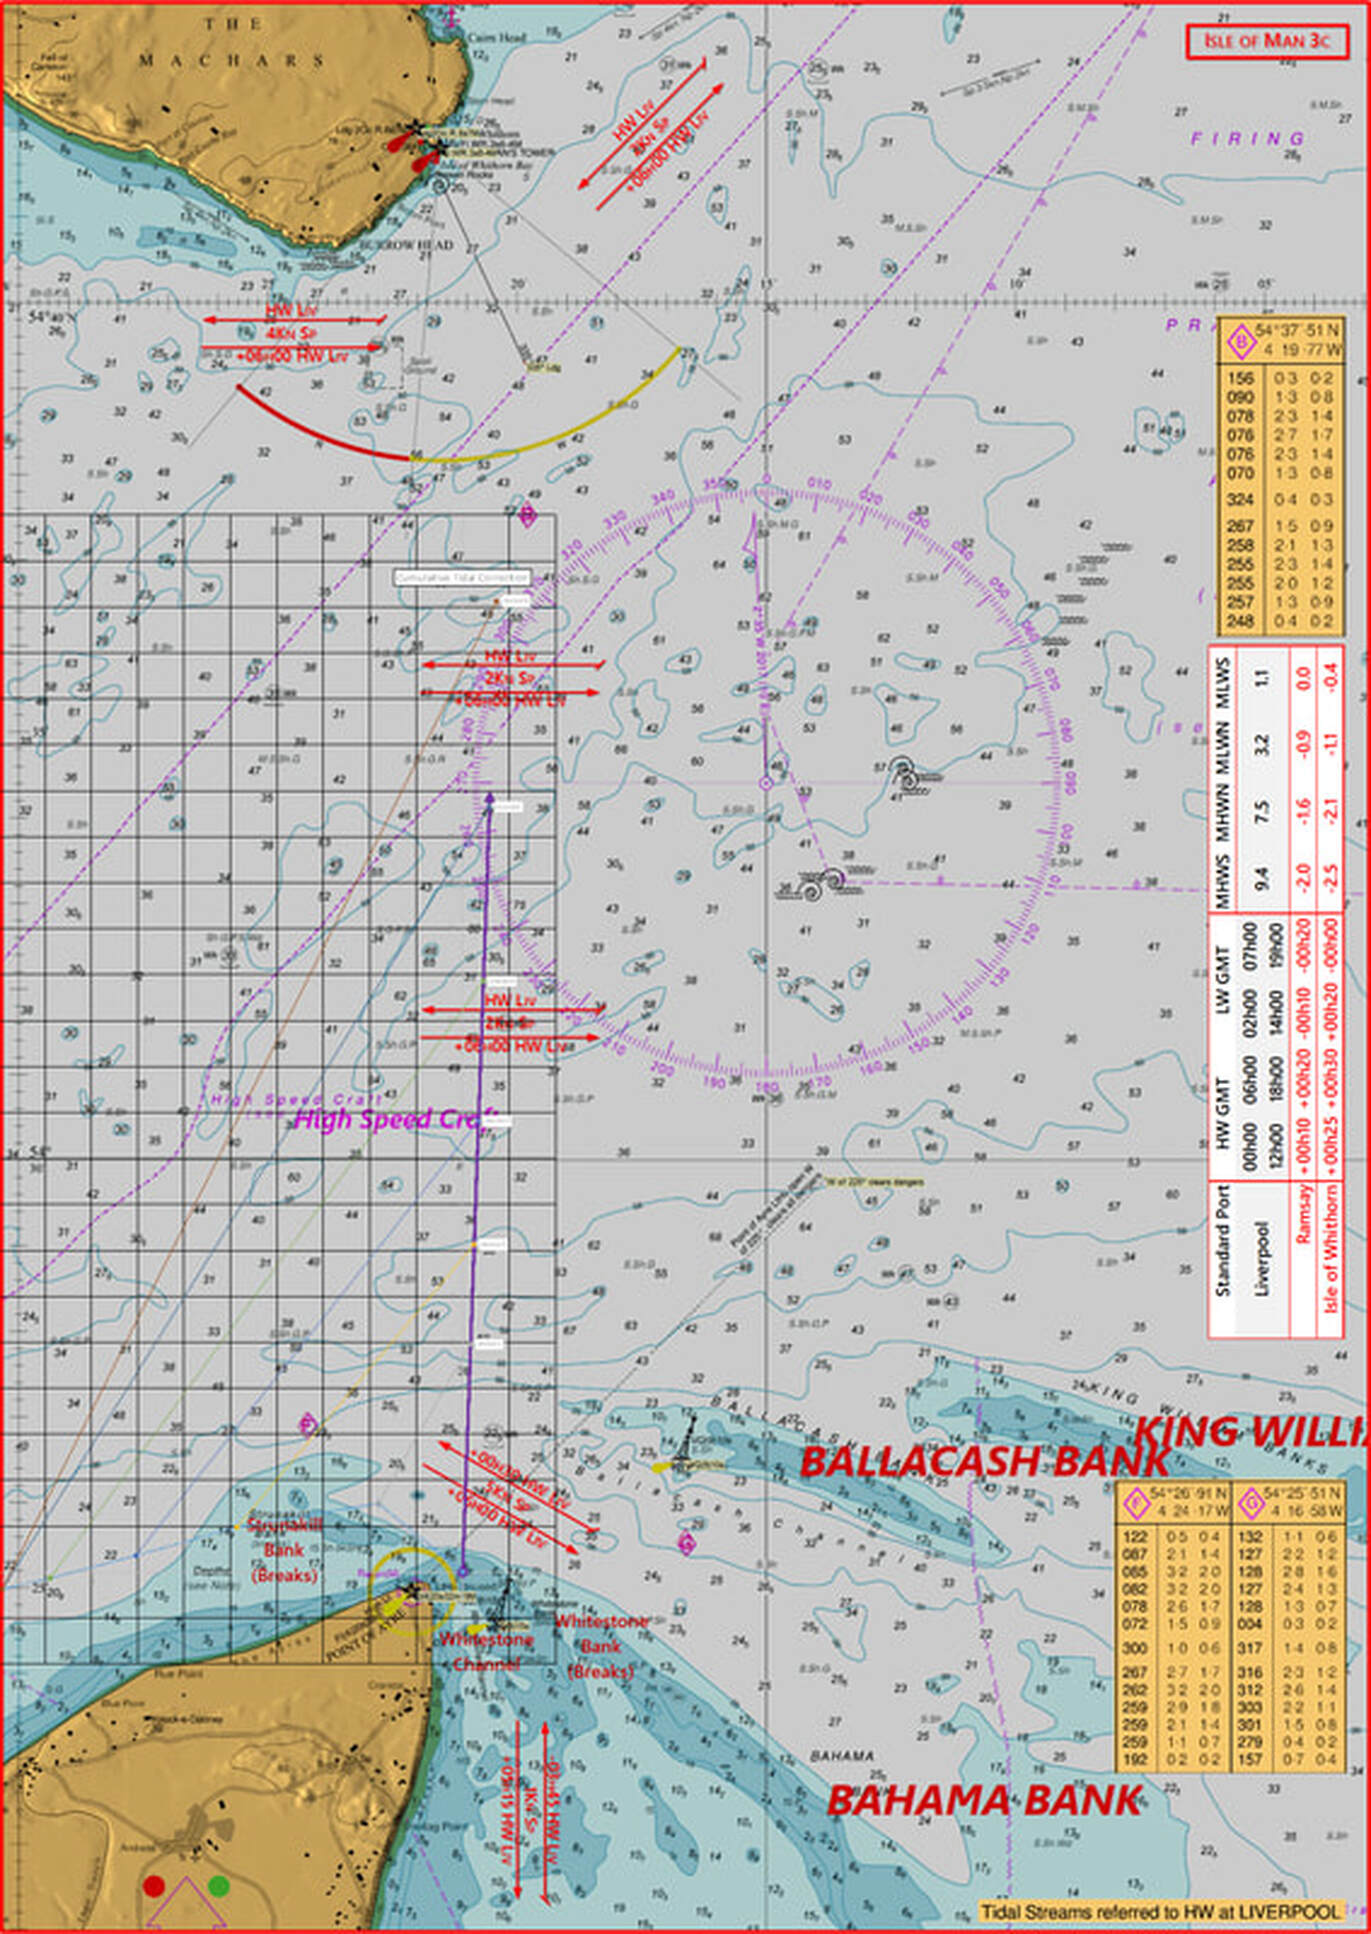
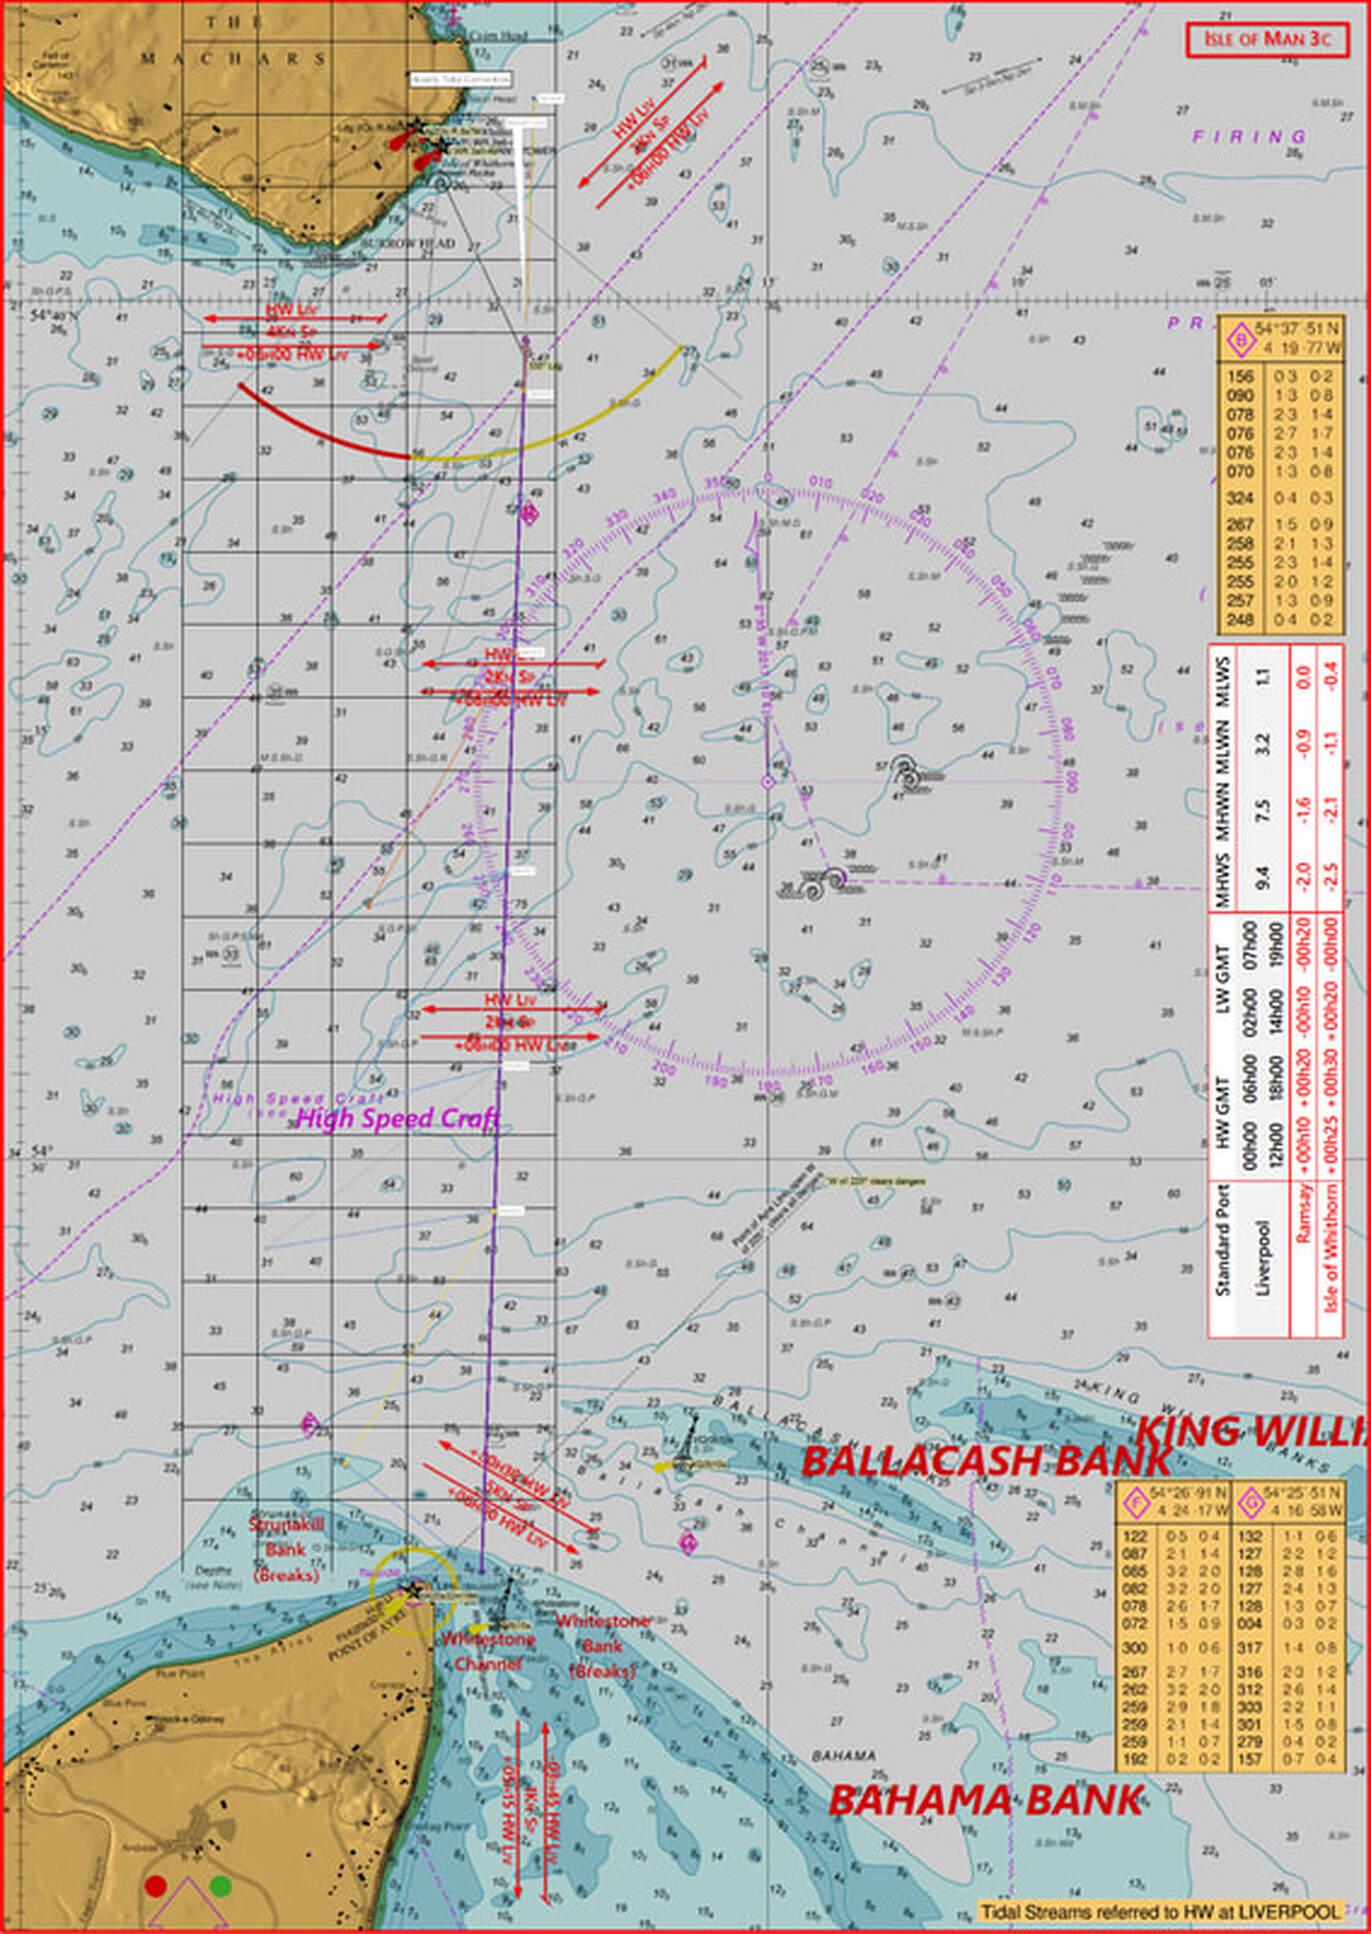
The spreadsheet calculates the specific tidal effect for each hour of the passage, using the tidal diamond you have chosen, and correcting for the hourly timing vs high water & the tidal coefficient. It then does the appropriate tidal vector addition & vector triangle solution to maintain the ground course - either cumulating the total tidal effect for the passage to the end of the specific hour, or doing a sequential correction hour by hour and allowing you to consider either. There are challenges with finding the solution to each vector triangle automatically - there are either two solutions - one of which is in the wrong direction that needs to be ignored, or no solution when the boat speed can't compensate for the tidal stream to stay on the ground course which needs to be indicated! Below shows the graphical output that illustrates the cumulative, or hour by hour correction, and below that the output overlayed onto the relevant chart for the crossing.
So it was an interesting challenge for a few hours programming - and maybe now I understand better why there isn't any automatic tool for this - unless someone knows better than me and can point me in the right direction.
Very happy to share the tool which you can download here - please let me know if you find any issues or have suggestions as to how to improve it!
8 Comments
clive banks
12/9/2022 21:14:58
Love the tone streams spreadsheet. Do you have the password please as I also want to use a version where I look up the rates for each hour rather than put in complete ranges as an English Channel crossing uses several different Tidal Ports
Stephen Smith
13/2/2023 12:40:42
It would certainly be a nice addition to be able to have at least 2 Tidal Ports. I suppose that you could also get a good enough result from playing around with two sheets - one to get you to a waypoint on the first tidal port and the second to get you from that waypoint to your destination on the other tidal port. Admittedly would require a bit of fiddling around to get the shortest cumulative course... 13/2/2023 19:57:53
Thanks for the comment Stephen. I'll have a think on how to integrate two tidal ports. I'll need to make sure to manage the time constant between them - which is subject to some vagaries - as I'm sure you're aware if you've looked at how dover to other tidal ports is handled on tidal stream atlases. The challenge being that the relative times of HW at the different tidal ports are not constant and vary.... 13/2/2023 19:53:18
Sorry very slow response - send me an email and I'll reply with an attached unprotected version of the file attached!
Stephen Smith
13/2/2023 12:26:57
Thanks for sharing this. I was thinking of doing something similar but feel no need whatsoever to recreate the wheel now! However, without being able to see the formulae I can't figure out why it's generating the results it does. Specifically, I was expecting that if I set the departure time to match the times corrected to the tidal port HW, the calculation table would pull exactly the vectors for the given tidal diamond...but you're clearly doing something more sophisticated as there is smoothing of the direction and averaging of the magnitude between each vector. How is the direction calculated? Also I can't figure out how to view the plot...it appears at the edge of the viewable window but I can't scroll over to see it. Is there a trick to that? 13/2/2023 20:03:06
Well the issue is that tidal diamonds give the tidal stream at a specific point in time - so when calculating an effect on a passage you need to appy this to the 30 mins before and after this specific time to a first approximation. I also correct for the tidal coefficient.
Stephen Smith
14/2/2023 12:39:47
Thanks Alan, yes I understood the averaging of rates (30 minutes of one and 30 minutes of the next)...but it doesn't seem to be an average for the direction (when hours are synchronised with the tidal port). Maybe you assumed a sine function between the directions of the start and finish of the hour? If you could share an unprotected version, that would be great just to get my head around it. 14/2/2023 15:34:46
Send me an email to alan@atlanticshoresseakayakguide.co.uk then I can reply and attach a copy of the file. It does the weighted vector addition of the tidal effects for the prior current an future hour - depending which will contribute to the specific hour of the passage. Long time since I did it so happy to have someone review it. I did do various check scenarios to validate the calculations! Leave a Reply. |